Oct. 15, 2024
 After years of frozen listings, there's finally hope for San Diego homebuyers.
It may not feel like it yet, but the San Diego's housing market Ice Age is finally thawing.
Would-be buyers and sellers in San Diego have found themselves stuck over the past couple of years. For-sale signs stood frozen in front yards as home shoppers balked at prices. Wild swings in mortgage rates discouraged almost everyone from venturing out into the market. Many felt as if they had no option but to stay put. But when I talk to housing experts these days, they speak cautiously of a shift in the weather, a warming in store for San Diego real estate.
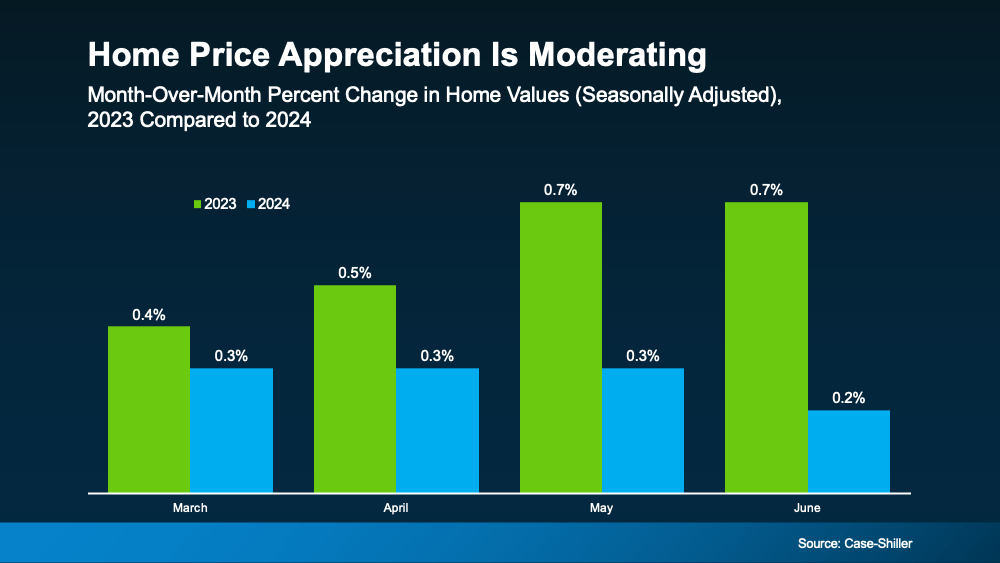
Green shoots are popping up everywhere. The typical borrowing rate for a 30-year home loan is near the lowest it's been in two years, which could nudge more sellers to emerge from hibernation. The pool of available homes on the market in San Diego is larger than at any point since the early days of the COVID-19 pandemic. While the median home price nationwide is up by 3% to 5% compared with a year ago, that's actually within the range that economists typically look for in a well-balanced market. If things keep trending this way, we should expect to see this coming spring, the time of year when transactions typically pick up, that more people are ready to get moving again.
Does this mean we're back to normal? Definitely not. Things may be more stable than they were during the peak of the home-trading frenzy or the depths of the slowdown, but that doesn't mean the housing market's problems are solved. It'll be hard for both buyers and sellers to shake off the pessimism of the past few years, especially when budgets are stretched so thin and home prices remain so high. That reality shouldn't obscure the encouraging signals, though. As I said earlier this year, a gummed-up housing market — the Ice Age I was talking about — is good for nobody. In half a year's time, we may be looking at a healthier one.
There's a tendency to look at housing in binary terms: Is it a better time to be a seller or a buyer? But a lot of people fall into both camps; most sellers have to turn around and purchase another home to live in. Recently, this fact of life has created what Skylar Olsen, Zillow's chief economist, calls the "musical chairs" problem: People can't jump up and find a new home if their neighbors aren't making similar moves, so everyone's stuck in their seats.
A big reason Americans find themselves trapped in place is what's known as the "lock-in effect." When mortgage rates hit multidecade lows during the pandemic, millions of people were able to snag or refinance their way into cheaper monthly costs. But starting in the spring of 2022, the rate for a typical mortgage soared, more than doubling from those pandemic-era lows. While it's come down from a two-decade peak last October, the prevailing loan terms are still about twice as expensive as they were back in 2021, which means a buyer could have to pay hundreds of dollars more each month toward interest than they would have a few years ago. A lot of people don't want to give up a good deal, so they don't make a change unless they absolutely have to. One paper from the Federal Housing Finance Agency suggested that the lock-in effect prevented a whopping 1.3 million home sales between mid-2022 and the end of 2023. A mere 2.5% of America's housing stock traded hands in the first eight months this year, according to Redfin, the lowest rate in at least three decades and 31% lower than in 2019.
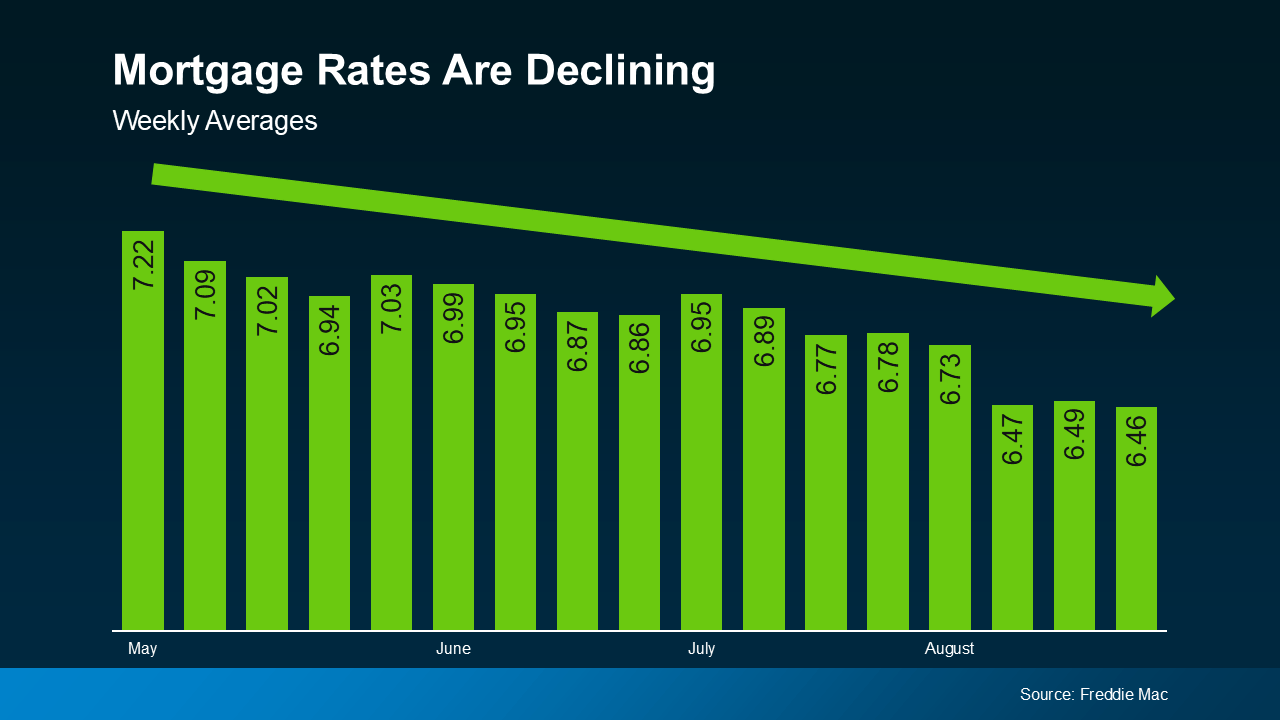
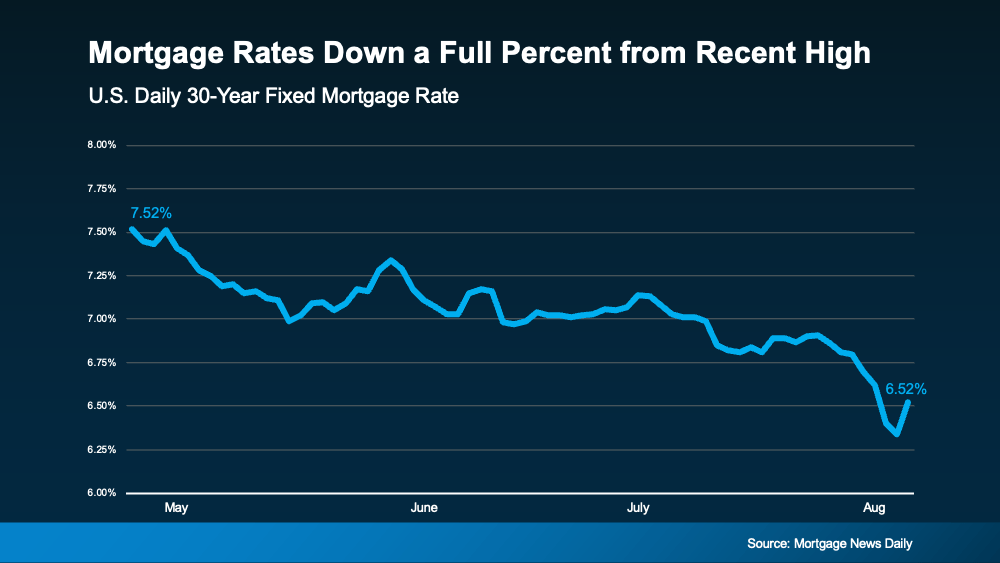
The recent drop in the typical rate for a 30-year loan — from about 7.2% in early May to 6.1% in early October — won't erase the lock-in effect, but it's an encouraging sign for buyers who have been grasping for anything that could ease the burden on their wallets. Even after a uptick in the last few days following the unexpectedly strong jobs report, more interest-rate cuts from the Federal Reserve, which signaled last month that it was turning its focus away from battling inflation, could further bring down mortgage rates, though there's not a direct connection between the two. Fannie Mae, for instance, predicts the rate for a typical home loan could end next year at 5.7%. That'd be within spitting distance of what the experts at John Burns Research and Consulting, a housing-research firm, call the "magic mortgage rate." Among homeowners and renters who said they planned to use a mortgage to purchase their next home, 47% told the firm in September that they'd be willing to sign up for a rate between 5% and 5.49%. Even if rates continue their downward trajectory, changes in mortgage payments typically take about six months to show up in home-sales activity, Ralph McLaughlin, a senior economist at Realtor.com said. So movement now could set the stage for a stronger uptick in sales next spring. Fannie Mae has also predicted that the total number of sales will be up by 10% in 2025 compared with this year, with most of that increase coming in the second half of the year.
While mortgage-rate movement can be a helpful guide for future activity, to get a full picture of what's actually happening in the real-estate market, you need to look at two data points: inventory, or the number of available homes on the market, and new listings, or the number of homes hitting the market. Olsen, the Zillow economist, likens inventory to a swimming pool and new listings to the spigot that keeps water flowing — as with any pool, too full or too empty is a problem. A balanced market is one in which there are enough new homes to meet the demand from buyers, but not so many that prices plummet. We're still a long way from refilling the pool of homes on the market: Inventory in September was down by about 23% from pre-pandemic levels, according to Realtor.com. But there is clear improvement taking place here, too. The number of active listings in September was up by 34% from the same month a year ago, increasing to its highest level since April 2020. The number of homes newly listed for sale in September was also up by 11.6% from last year. By slowing down home sales, higher rates have given inventory time to build back up from pandemic lows — homes are lingering on the market longer with fewer buyers, so the pool's water level has steadily climbed.
More homes to choose from, lower mortgage rates — that's a "powerful combination," said Lawrence Yun, the National Association of Realtors' chief economist, adding that sales should move higher in the coming months as a result. Buyers can take heart in another data point, which is that far fewer homes are being snapped up as soon as they hit the market. According to the housing-data firm Altos Research, there were about half as many "immediate sales" in late September as there were in 2022. "It looks like that frenzy is finally gone," Altos' president, Mike Simonsen, said in a recent video update.

There wont be dancing in the streets, but it would be a marked improvement from the past couple of years.
The baseline expectation for the spring, the Redfin economist Chen Zhao says, is a modest uptick in sales and new listings. Most economists don't expect mortgage rates to fall dramatically, meaning sellers will slowly start to reenter the market as they decide it's time to make a change. New listings this year increased by about 5% a month on average compared with the same months in 2023 — you might expect to see that climb a little next year, Zhao told me, to maybe 10% year-over-year growth. The total number of homes on the market each month tended to be about 10% or 15% higher than last year, but you might see that rise to 20% or 25% when you compare 2025 with this year. This is the housing's version of a soft landing; there won't be dancing in the streets, but it would be a marked improvement from the past couple of years.
"Even though the housing market is recovering, the recovery is going to be very slow," Zhao says. "We're not going to see anything like the activity that we saw in 2021 or 2020 — or even 2019, 2018 — for a while."
Still, if buyers are feeling better about their prospects, that should grease the wheels of America's housing market.
It is important to note that forecasts are just forecasts. There's a lot that could change in the next year. The strength of the job market is a big question mark — people won't move if they don't feel sure about their next paycheck. There are huge regional differences to consider here, too. Builders have finished a lot more new housing in Sun Belt states in the lower half of the US, for example, which has made it harder for homeowners there to sell at their desired prices than for their counterparts in the Midwest or the Northeast. Affordability is still a huge pain point. An August survey by Fannie Mae suggested consumers were feeling remarkably optimistic about the future of mortgage rates, but only 17% of respondents said it was a good time to buy a home. Any one of these issues could chill the market and slow America's exit from the Ice Age.
That said, it's impossible to ignore the signs of a shift underway. Mortgage rates are a key piece of the equation. I'll also be keeping a close eye on inventory and the pace of new listings hitting the market, which should heat back up starting around February and March. But all this focus on the numbers can obscure the simple fact that people have to move for all kinds of reasons that have nothing to do with a few digits and a percent sign.
Mark Palim, the chief economist at Fannie Mae, leaves me with a salient piece of advice: "Leave timing the bond market to the hedge-fund guys." In other words, trying to predict mortgage rates — and buying or selling a home accordingly — is a fool's errand. Budgets matter, absolutely, and monthly payments are a crucial consideration for any buyer. But buyers and sellers should remember that their home isn't just an investment vehicle or a bet on where the economy is headed. At the end of the day, you have to live in it.
"All sorts of things can happen," Palim says. "Rates may move. Home prices may go up, home prices may go down. But would you be happy living there for a while? Does it meet your needs?"
Let me know your thoughts below...
 Looking to buy a home in San Diego but feeling like almost everything is out of reach? Here’s the thing. There’s still a way to become a homeowner, even when affordability seems like a huge roadblock – and it might be with a fixer upper. Let’s dive into why buying a fixer upper could be your ticket to homeownership and how you can make it work.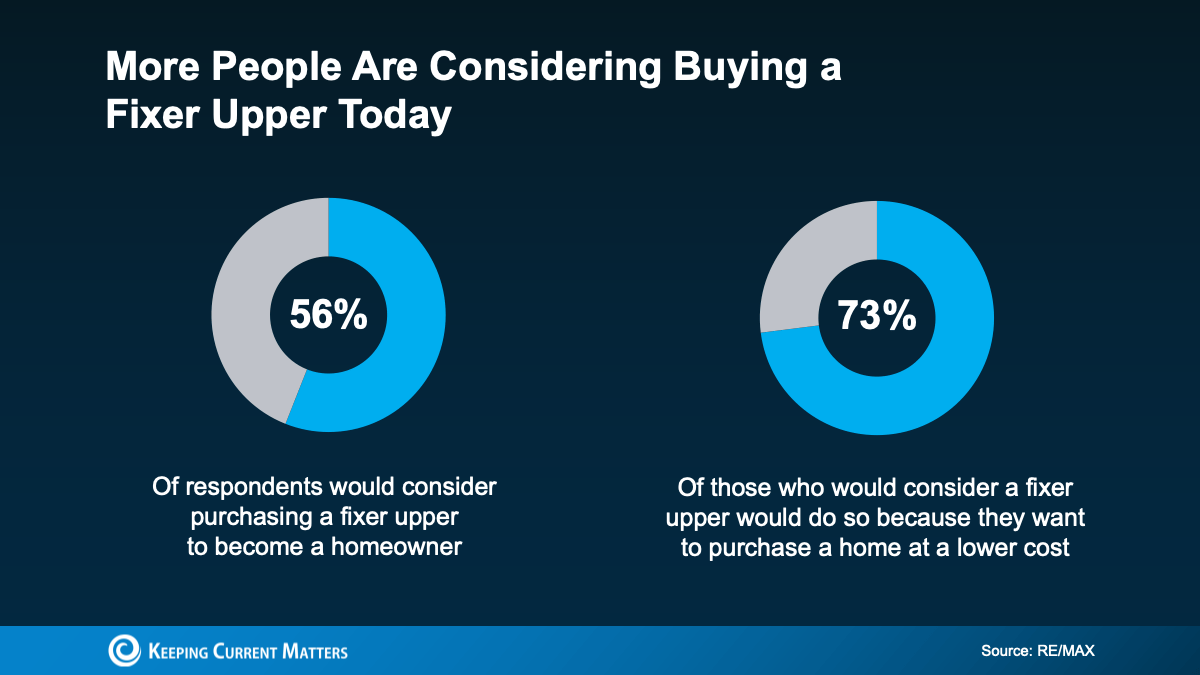


.jpg) It may have gotten a little easier to buy a home in the San Diego market, according to a new reports by numerous sources.
It may have gotten a little easier to buy a home in the San Diego market, according to a new reports by numerous sources.